What If Your Reports Came to You With the Answer?
A reflection on how an AI layer on top of 1C, ERP and BI can find problems on its own and bring managers ready-made decision options — and what it should not do.
2026-11-21

Monday, 9:00 a.m.
Monday, nine in the morning. The head of purchasing opens the accounting system, exports stock levels to Excel and starts looking for what changed over the weekend. Which items are running out? Which supplier is late? Why did sales of one product group go up while the margin went down?
By lunchtime the picture is more or less clear. Some problems have been found. Others haven’t, because nobody got around to the right report. The company will learn about them later: from a customer complaint, an empty shelf, a write-off at the end of the quarter.
This isn’t a story about a bad employee. It’s a story about how working with data is set up in almost any company.
The data is there. The answers aren’t
Most companies have no shortage of data — at least in volume. Sales, stock, deliveries, prices and payments sit in 1C, the ERP, the BI system and dozens of spreadsheets.
The problem is elsewhere. Turning data into a decision takes a person who:
- knows which report to look at;
- spots a deviation among hundreds of rows;
- connects causes across different systems;
- finds the time to do all of this.
So the quality of management decisions depends on the experience and workload of a specific person. An experienced manager goes on vacation — and for a week nobody notices the problems. Reports keep multiplying, but the time to read them doesn’t.
Systems answer questions. But a person still has to ask them.
What if it worked the other way around?
Picture the same Monday. But now the head of purchasing doesn’t start by searching — they start with a short list. The system has already gone through the weekend’s data and brought up three questions that need a decision today.
The first card looks like this:
- Signal: high risk of a stockout in the warehouse for one product group within the next 10 days.
- Fact: current stock, consumption rate, confirmed orders and delivery lead times.
- Hypothesis: demand has picked up, and the supplier delayed the last delivery.
- Recommendation: request an expedited delivery or adjust the purchasing plan.
- Alternatives: rebalance stock between branches or temporarily adjust the order.
- Expected impact: calculated on actual data.
- Confidence: medium — delivery lead time data is incomplete.
- Owner: the buyer responsible for this product group.
Three things matter in this card. Facts are kept apart from guesses: you can see what is known for sure and what is only an assumption. The numbers are calculated, not generated. And the decision stays with a person: the system suggests options but orders nothing on its own.
This isn’t one more report. It’s an answer that arrived before you asked the question.
Something for everyone
The same principle works at every level of management. Only the scale of the questions changes:
- CEO — strategic risks and opportunities, response scenarios. For example: profitability of one business line is falling — here are the options.
- CFO — deviations in P&L, working capital and cash flow. For example: more and more money is tied up in inventory.
- Commercial director — assortment, pricing, promotions, margin, demand. For example: a category is growing in sales but losing margin.
- Purchasing — shortages, surpluses, supplier lead times and terms. For example: an item is at risk of running out in 9 days.
- Logistics and warehouse — stock imbalances, delivery delays, distribution. For example: surplus in the central warehouse, shortages in the branches.
- Regional or branch manager — deviations by location, their causes and corrective actions. For example: a group of stores is losing sales because fast-moving items are out of stock.
- Store or department manager — local tasks for today. For example: slow-moving stock that is due for a clearance.
This isn’t about hundreds of notifications. Each person gets a few of the most important recommendations — weighed by their authority, the size of the impact, urgency and how far the data can be trusted. A system that makes noise stops being read within a week.
What’s under the hood
No magic, and no single giant neural network that “knows everything”. A system like this is built from a few clear layers:
- Data. Connections to 1C, ERP, BI and operational systems. Shared master data, common KPI definitions, quality control and access rights.
- Detection. Control rules, anomaly detection, demand and stock forecasts, risk assessment.
- Decisions. Hypotheses about causes, options for action, constraint checks, impact calculation — and counterarguments.
- Explanation. A language model turns the calculations into plain language: what happened, what the conclusion rests on, how reliable it is.
- Delivery. A recommendation feed, a morning digest or a card in a familiar channel — tailored to each role.
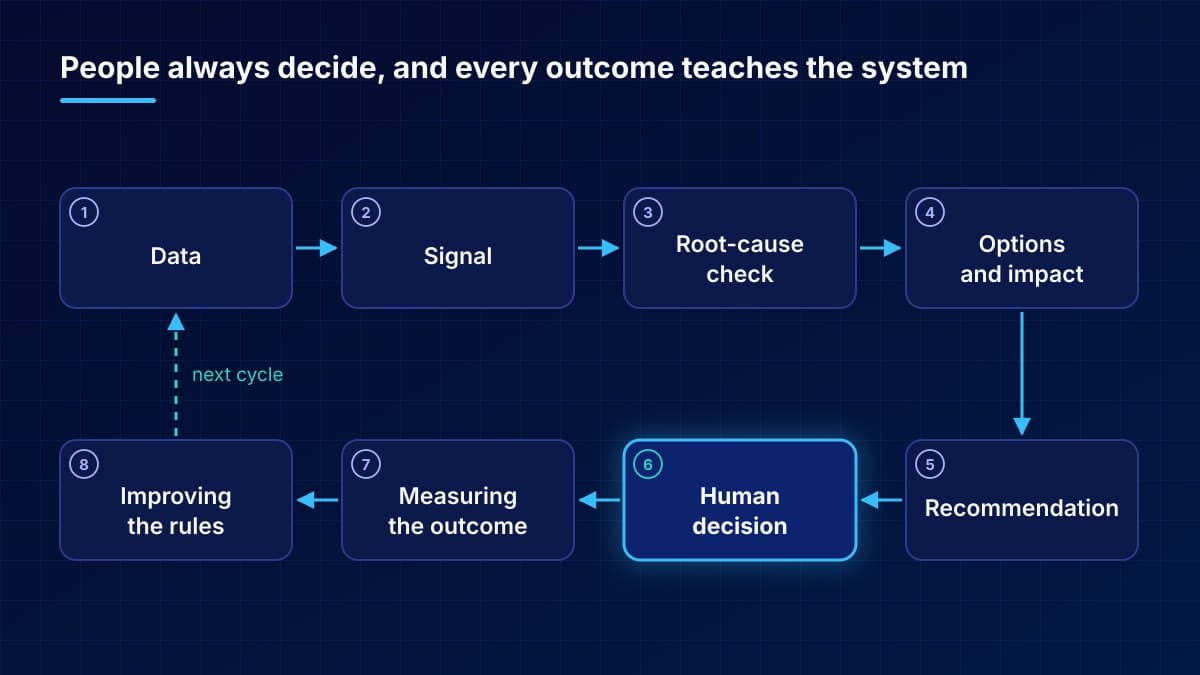
- Memory. A log of recommendations, decisions made, forecasts and actual results.
The key split: the numbers are calculated by the analytics core, not by the language model. The LLM explains, but it doesn’t make up figures. Otherwise, such a system can’t be trusted.
The most underrated layer is the last one. When the system remembers what it recommended, what the person decided and how it all turned out, it starts learning from your company’s own decisions. The idea owes a lot to Ray Dalio’s “Principles”: objectivity, open review of mistakes, formalized decisions and feedback.
What it doesn’t do
What such a system shouldn’t do matters as much as what it does. At least at the start:
- It doesn’t replace managers. It brings a decision with evidence and alternatives. A person chooses.
- It doesn’t act on its own. No automatic purchases, price changes or instructions without human approval.
- It doesn’t replace 1C, ERP or BI. It’s a layer on top of existing systems, not yet another migration.
- It isn’t a chatbot for every department. Separate bots quickly turn into a new “zoo” of systems. What’s needed is one platform with shared data and different roles.
- It doesn’t rate people. The goal is better decisions, not an employee ranking.
- It doesn’t promise ROI in advance. The effect can only be proven by comparing it with how the company worked before.
More on these limits — and on why so many AI promises fall flat — in the next article.
Where to start
The most common mistake is trying to build a complete “corporate AI” all at once. The opposite path works:
- Pick one process where decisions are frequent, the data already exists and the cost of a mistake is clear. For example, purchasing, inventory management or receivables control.
- Record how things work today: the accuracy of current forecasts, the time spent finding problems, the level of shortages and surpluses.
- Launch two or three scenarios and compare the system’s recommendations with people’s decisions and with a control group.
- From day one, keep every recommendation and its outcome.
- Expand to new processes and roles only once the benefit is proven in numbers.
Each new module uses data that has already been collected and the same architecture. That’s why every next step is easier than the one before.
And now a question for you. Which report does your company open every morning to find a problem? And what if the problem found you instead?
FAQ
Will a system like this replace managers?
No. It finds problems, explains causes and suggests options with the impact calculated. The decision and the responsibility stay with a person.
Do we have to replace 1C or our ERP?
No. It’s a layer on top of existing systems: it reads data from 1C, ERP and BI and doesn’t replace them.
Where should we start?
With one process where decisions are frequent, the data already exists and the cost of a mistake is clear — for example, purchasing or inventory management. First we record how things work today, then we compare the recommendations with people’s decisions.
An IT Ecosystem for Your Business: From a “Zoo” of Programs to One System